Trading process
Why a 60% win rate can still lose money

At a glance
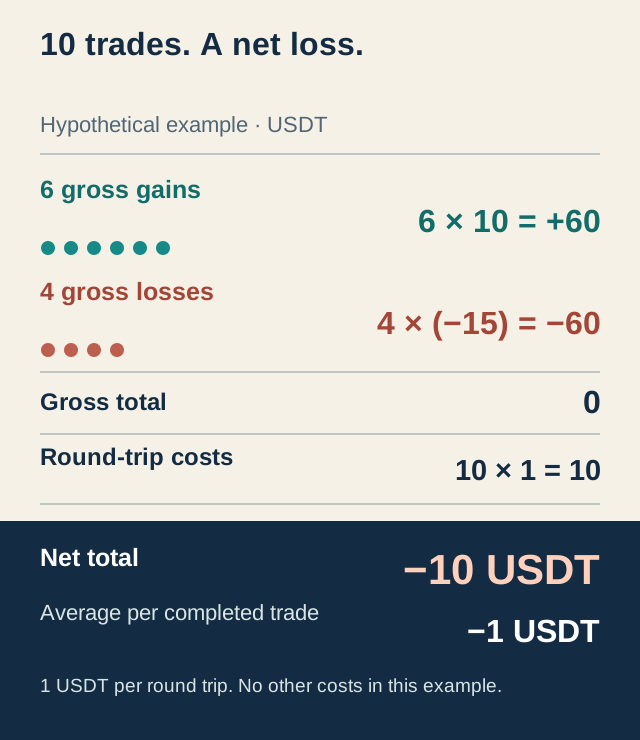
Win rate counts profitable trades; it does not measure their size or total costs. In this invented example, six gains of 10 USDT and four losses of 15 USDT cancel before costs. Deducting 1 USDT per completed round trip leaves −10 USDT net, or −1 USDT per trade. The sample describes arithmetic, not future performance.
On this page
Six profitable trades out of ten can still leave less money at the end. The count says how often a trade finished positive; it does not say whether those gains paid for the losses and costs.
In the invented example below, six trades earn 10 units each before separately charged costs, while four lose 15 each. The gross gains and losses cancel. A total round-trip cost of 1 USDT per completed trade then produces a net loss of 10 units. The 60% figure remains true.
Start with completed trades and a clear definition
For this example, one trade means a position opened and fully closed. A position filled in several pieces still counts as one trade under this convention. All example amounts are in USDT; they are token-denominated amounts, not a claim about their fiat value.
We label a trade gross-positive when its realized price profit is above zero before the separately listed cost. A net winner finishes above zero after that cost. These counts happen to match in our example, but a small gross gain can become a net loss once costs are included. Label the basis whenever you report a win rate.
CME’s explanation of mathematical expectation combines the frequency of wins and losses with their average sizes. Its lesson concerns commodity futures; we use the arithmetic, not a claim that any strategy will succeed.
Ten trades: six gains, four larger losses
Every number in this table is invented for education. These are USDT amounts, not percentages of an account. The cost is 1 USDT for the whole round trip, covering entry and exit together in this simplified example. It is not 1 unit per order or per side, and it is not an exchange fee quotation.
| Completed trade | Gross result | Round-trip cost deducted | Net result |
|---|---|---|---|
| 1 | +10 | 1 | +9 |
| 2 | −15 | 1 | −16 |
| 3 | +10 | 1 | +9 |
| 4 | +10 | 1 | +9 |
| 5 | −15 | 1 | −16 |
| 6 | +10 | 1 | +9 |
| 7 | −15 | 1 | −16 |
| 8 | +10 | 1 | +9 |
| 9 | +10 | 1 | +9 |
| 10 | −15 | 1 | −16 |
| Total | 0 | 10 | −10 |
Six gross gains total +60. Four gross losses total −60. Subtracting 10 units of costs leaves −10. The average net result is therefore −10 ÷ 10 = −1 unit per completed trade.
The same result can be checked using the net outcomes: 6 × 9 − 4 × 16 = −10. This second calculation already includes costs; subtracting another 10 would count them twice.
What “expectancy” means in this calculation
Let p be the fraction of gross-positive trades, W the average gross gain, L the positive magnitude of the average gross loss, and c the average separately deducted cost per completed trade. With no gross break-even trades in this two-outcome example:
Average net result = p × W − (1 − p) × L − c
Here, 0.60 × 10 − 0.40 × 15 − 1 = −1. The loss magnitude L is 15, not −15; the formula already subtracts it.
TradingView defines expected payoff as total net profit or loss divided by completed trades and excludes floating results from open positions. That gives a useful cross-check against the weighted calculation. We are describing the average in a specified sample. Calling it expectancy does not turn that sample into a reliable estimate of future returns.
If a real history contains gross break-even trades—zero realized price profit before separately listed costs—keep them in the total trade count and report them separately. The gross-losing fraction is then not automatically 1 − p, and a gross break-even trade can finish net-negative after costs. Summing all completed net outcomes and dividing by their count avoids forcing a three-category history into this two-category formula.
Why the illustrative break-even rate is 64%
Hold the example’s payoffs and cost fixed, and solve for the fraction p that makes the average zero:
0 = 10p − 15(1 − p) − 1 = 25p − 16
So p = 16 ÷ 25 = 0.64, or 64%. Before costs, the same equation would give 15 ÷ 25 = 60%.
This 64% is a mathematical threshold under the stated assumptions. A batch of exactly ten trades cannot contain 6.4 winners: its win count changes in whole trades. Seven +10 results and three −15 results would produce +15 net units after the same ten units of costs. Neither the threshold nor that alternative calculation says seven wins are achievable.
The threshold also changes when realized gains, losses or costs change. It is not a universal target for crypto trading and does not justify increasing position size or trading more often.
Reconcile the inputs before judging the percentage
A planned take-profit or stop distance is not an average realized win or loss. Use completed outcomes from the same chosen period, with a consistent rule for grouping fills. Our trading journal review explains how to preserve the records behind those numbers.
- Total the positive realized gross outcomes and divide by their count to find W. Total the magnitudes of negative gross outcomes and divide by their count to find L. If a group has no trades, do not invent an average for it.
- Identify what the platform’s result field already includes. If it is already net of a charge, do not subtract that charge again. Use the realized profit and fee reconciliation guide to separate fields before adding them.
- Subtract separately recorded charges and add separately recorded credits only when they belong to the selected trades and are missing from the result. Document any allocation of financing or other costs; do not silently assume the example’s fixed cost applies.
- Compare total net trading results with the sum of the individual completed outcomes. Keep deposits, withdrawals and open-position valuation changes separate from this closed-trade calculation.
The SEC’s investor bulletin on fees and expenses, dated July 23, 2025, explains that costs reduce returns and points readers to disclosures, statements and trade confirmations. It provides general U.S. investor education, not a crypto exchange fee schedule.
Actual fill prices already reflect the execution you received. If a realized price result uses those fills, subtracting an estimated slippage amount from it again would duplicate that effect. A comparison against an earlier reference price can still explain execution quality; our slippage article covers that separate comparison.
A sample result is a description, not a trading promise
Report the trade count and period alongside the percentage, the realized average gain and loss, and the net total. A high win rate can coexist with a loss, while the same win rate can produce a different result with different payoffs. Even a positive historical average would not establish future profitability or describe the size and order of possible losses.
Our ten rows are an arithmetic demonstration. They are not customer transactions, a backtest, a forecast or a tested trading system.
Editorial note: CoinFom prepared this article with AI-assisted research, writing, translation and review. Sources checked October 28, 2026. Educational information, not personalized investment advice. CoinFom may earn referral commissions elsewhere; this article has no signup link. See About CoinFom, our editorial policy, and corrections.