Indicators and limits
Moving-average crossings can multiply trades, not insight

At a glance
A moving average smooths past prices and responds with lag. In sideways movement, price can repeatedly cross the average without a lasting trend. Any trading rule based on crossings needs explicit execution assumptions and costs.
On this page
A clean line on a chart can make a noisy decision look precise. The line is a calculation; a trading instruction adds assumptions about timing, execution and what to do when the signal changes again.
Build a small example by hand
Fidelity explains a simple moving average as the mean over a chosen window. TradingView's documentation describes moving averages as reactive, with different smoothing choices. Neither fact establishes a profitable rule for a crypto pair.
Take fictional closing prices of 100, 102, 100, 102, 100, 102. A three-close simple average produces:
| Close number | Price | Three-close SMA | Price relative to SMA |
|---|---|---|---|
| 3 | 100 | 100.67 | Below |
| 4 | 102 | 101.33 | Above |
| 5 | 100 | 100.67 | Below |
| 6 | 102 | 101.33 | Above |
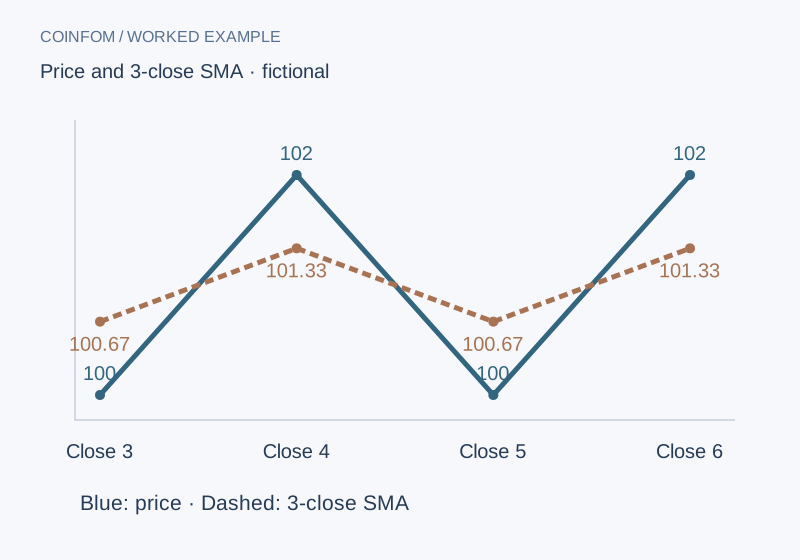
The unrounded averages are 302/3 and 304/3. The classification flips three times even though the sequence remains in the same narrow range. This is a constructed arithmetic demonstration, not market data or a measured failure rate.
Add a clock to the rule
If a rule depends on a completed closing price, it cannot honestly assume you knew that final close earlier in the bar. Specify when the signal becomes available and when the order is sent. A backtest that buys at a price unavailable after the decision can overstate results before fees even enter the calculation.
A live unfinished bar may cross the average and later close back on the other side. Decide in advance whether the rule uses completed bars, rather than switching interpretation after observing the outcome.
Count each execution
As a separate cost illustration, six executions of 500 USDT each at a hypothetical 0.1% rate produce 3 USDT in fees: 6 × 500 × 0.001. Slippage and price P&L are additional. This is not the P&L of the table's sequence and not any exchange's quoted rate.
Longer averages can smooth more but react later; shorter ones change faster. Choosing whichever window looks best on the same data is not evidence of future performance. Keep a separate evaluation period and a baseline, and show costs alongside gross results.
For the difference between chart values and executions, read slippage. No strategy return or recommended buy/sell rule is claimed here.
CoinFom editorial note: research, writing, translation and review used AI assistance. No live transaction was performed for this article. Numerical examples are hypothetical and do not demonstrate returns. Sources checked September 26–27, 2026. Educational content, not personalized advice. See About CoinFom, our editorial and affiliate policy, or send a correction. CoinFom may earn referral commissions on other pages; this article contains no signup link.