Indicators and limits
RSI above 70 is a reading, not a sell command

At a glance
RSI summarizes the balance of recent gains and losses under a defined calculation. A high reading can persist during a trend. It does not supply the next price, a reversal time or a verified probability of profit.
On this page
The label overbought sounds like a valuation judgment. On an RSI panel, it is a conventional description of a momentum reading. It does not prove that a token is overpriced or that selling now has a positive expected return.
What enters the calculation
Fidelity's indicator guide describes RSI and notes that extreme readings can persist during strong trends. TradingView documents its implementation, including smoothing and input choices. The timeframe and price source are part of the measurement, not optional decoration.
For a transparent arithmetic example, suppose the already-computed smoothed average gain is 3 price units and average loss magnitude is 1. Relative strength is 3/1 = 3, so RSI = 100 − 100/(1 + 3) = 75. We deliberately supply the averages; this is not a historical backtest or a reconstruction of a full 14-bar series.
| Assumed average gain | Assumed average loss | Resulting RSI |
|---|---|---|
| 3 | 1 | 75 |
| 1 | 1 | 50 |
| 1 | 3 | 25 |
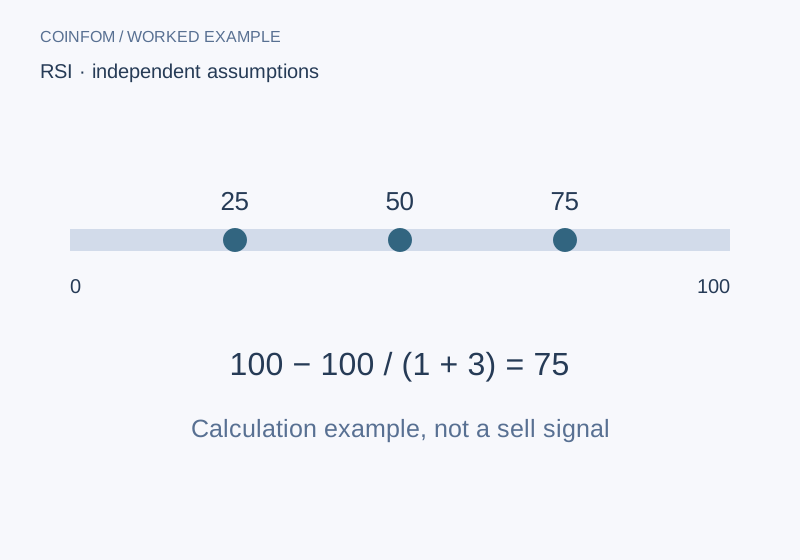
These three independent examples illustrate the formula. They are not consecutive observations or an instruction to trade at any threshold.
The missing forecast
No future return appears in the formula. To claim that RSI 75 predicts a decline, you would need a separate test specifying asset, market, timeframe, entry, exit, costs and evaluation period. A screenshot of one successful reversal cannot establish that relationship.
RSI on a five-minute chart and RSI on a daily chart summarize different intervals. If the current bar has not closed, its input can still change. Record the bar timing and settings before comparing two screenshots or calling their disagreement a data error.
A research protocol rather than a signal
Write down the proposed rule before inspecting its results. Keep a later period separate from the period used to choose parameters. Include losing observations, unfilled orders and transaction costs. Compare against a stated baseline instead of reporting only a win rate. Do not choose the best threshold after seeing the entire outcome and call it a forward test.
CoinFom has not run such a strategy test for this article. The purpose is to explain the measurement and the evidence a stronger claim would require. Our trading-journal worksheet helps separate a recorded decision from a story reconstructed after the result.
CoinFom editorial note: research, writing, translation and review used AI assistance. No live transaction was performed for this article. Numerical examples are hypothetical and do not demonstrate returns. Sources checked September 26–27, 2026. Educational content, not personalized advice. See About CoinFom, our editorial and affiliate policy, or send a correction. CoinFom may earn referral commissions on other pages; this article contains no signup link.